

Opinion & Discussion. This piece argues a point of view, and says so. The facts it rests on are sourced and labeled; the conclusions in the Our view section are ours. Part of Controversial Topics.
We would love to help everybody. Most Americans feel that pull, and it is a good instinct. But no country can take everyone who would like to come. The United States can only absorb so many newcomers a year and still keep its promises to the people already here, including the immigrants who came the right way.
This piece lays out the facts first and labels how solid each one is. Then it tells you where we come down. You may land somewhere else, and that is the point of a discussion.
Legal and illegal immigration, explained
- Lawful permanent residents (green-card holders). People admitted to live and work here permanently, mostly through family sponsorship or a job, plus refugees and asylees who adjust status and winners of the diversity visa lottery. The U.S. granted 1,364,090 green cards in fiscal 2024, according to DHS’s Office of Homeland Security Statistics. Most can apply for citizenship after five years, or three if married to a U.S. citizen.
- Temporary visa holders. Students, tourists, and seasonal or skilled workers admitted for a set purpose and time. The H-2A visa for seasonal farm work, for example, has no annual cap.
- Refugees and asylum seekers. Both must show a well-founded fear of persecution because of race, religion, nationality, political opinion or membership in a particular social group. Refugees are screened and approved overseas before they travel. Asylum seekers ask for protection after reaching the U.S. or a port of entry. Poverty, or general danger from crime, does not by itself qualify.
- Illegal immigration. Crossing without inspection is a federal misdemeanor for a first offense, and re-entering after deportation is a felony (8 U.S.C. 1325 and 1326). Overstaying a visa is a civil violation that can lead to removal, so some people in the country illegally entered legally and stayed too long.
- The gray zone. Millions of people have temporary permission but no permanent status: humanitarian parole, Temporary Protected Status, or a pending asylum case. Research groups estimate that 5.4 million to 6.3 million of the 2024 unauthorized population had some protection of this kind, Stateline reports.
The numbers right now
Illegal crossings at the southern border are the lowest in Border Patrol history
✅ Confirmed  Factual Lean note: CBP’s own data, matched by Pew’s independent analysis. DHS press releases add partisan framing, which we leave out.
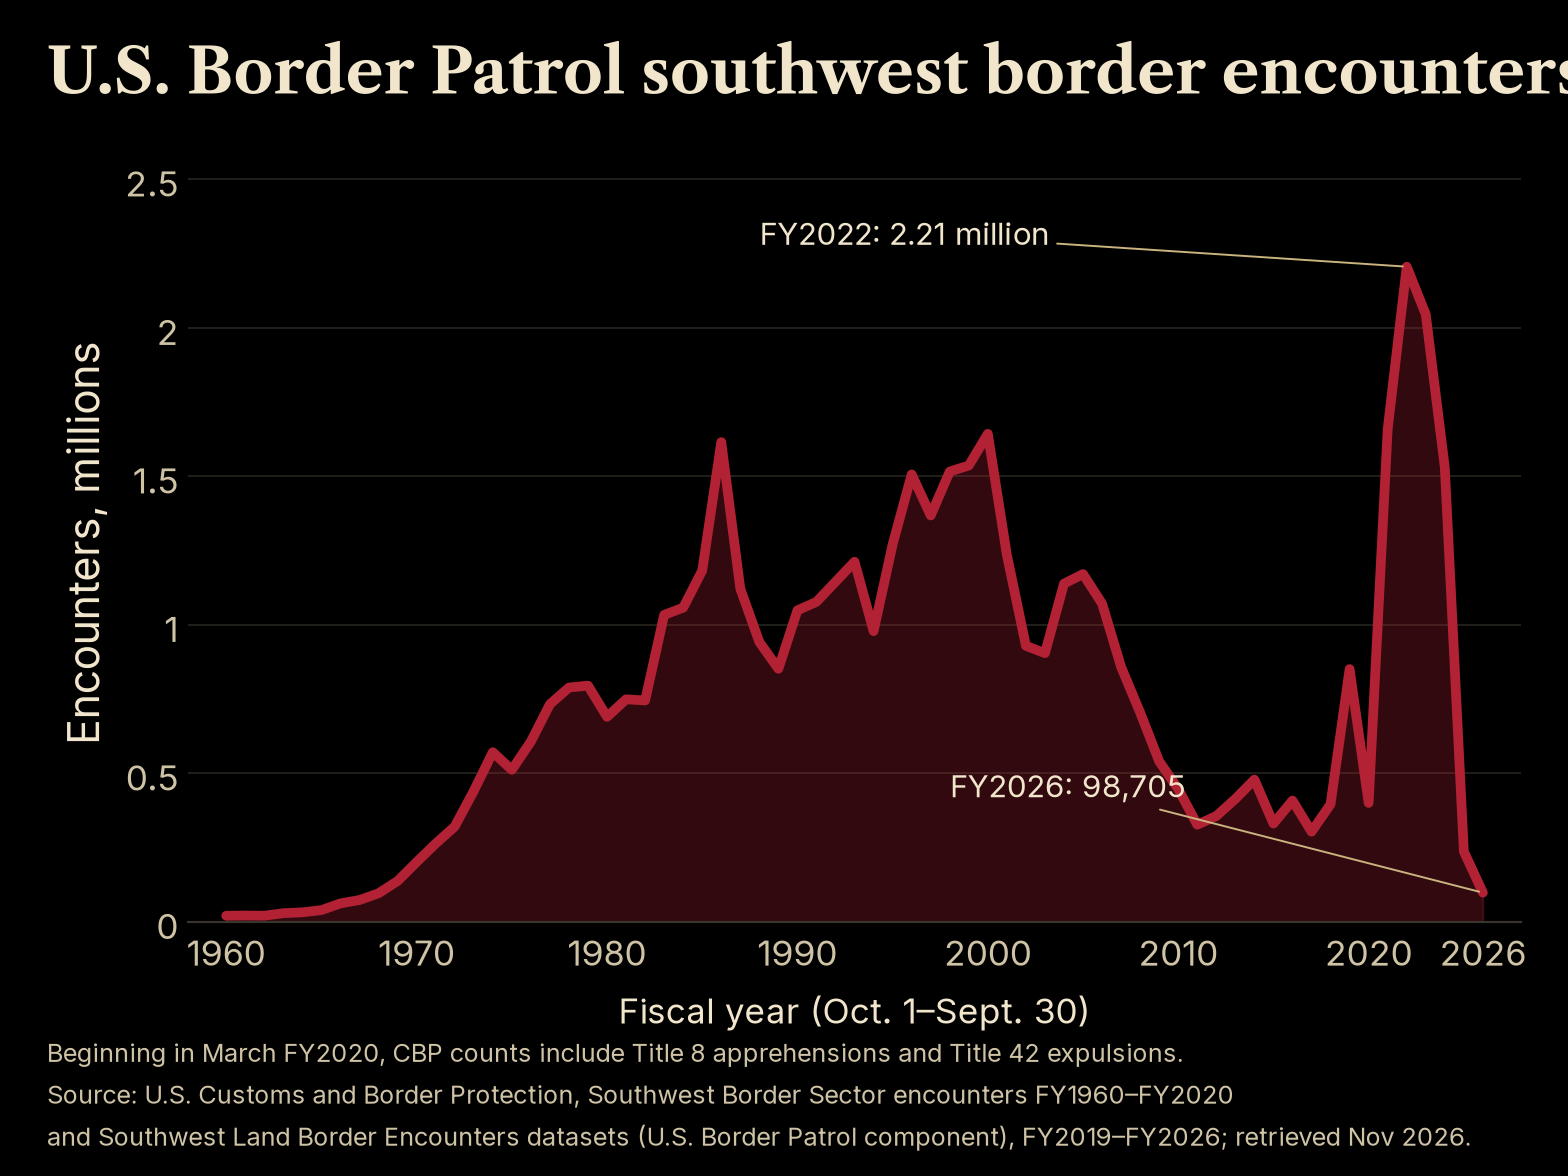
Border Patrol apprehensions at the U.S.-Mexico border hit a record of about 2.2 million in fiscal 2022 and stayed above 1.5 million in 2023 and 2024, according to Pew Research Center’s analysis of Border Patrol data. They fell to 237,538 in fiscal 2025, the lowest since 1970, and to 98,708 in fiscal 2026 (October 2025 through September 2026), according to preliminary CBP figures. Nationwide CBP encounters, which include ports of entry and airports, were 379,243 in fiscal 2026, the fewest in the agency’s history, three years after the record set in fiscal 2023.
Roughly 13.5 million to 15.8 million people are here illegally, depending on who is counting
✅ Confirmed Factual Lean note: Estimates from groups on different sides of the debate land in the same range. The exact 2026 figure is uncertain.
- DHS (official): 11.0 million as of January 2022, the government’s most recent published estimate.
- Pew Research Center: a record 14.0 million in mid-2023, likely peaking in 2024 before declining in 2025.
- Migration Policy Institute: 15.8 million in mid-2024. The Center for Migration Studies of New York put 2024 at 14.6 million.
- Center for Immigration Studies: 13.5 million in July 2026, down from 15.8 million in January 2025.
Every one of these is an estimate built from Census Bureau surveys, not a head count. Survey response among immigrants has dropped amid stepped-up enforcement, which makes the 2025 and 2026 figures harder to pin down.
Deportations are at record levels for ICE, and many people are leaving on their own
✅ Confirmed Factual Lean note: ICE totals are DHS’s own, and MPI’s analysis of FOIA data broadly fits them. The “3 million left” figure is a DHS claim that MPI disputes.
ICE carried out 483,200 deportations in fiscal 2026, its highest total ever, up from 442,640 in fiscal 2025, DHS says. The Migration Policy Institute counted about 980,000 deportations by ICE and CBP combined from January 20, 2025, through July 31, 2026. Of those, 69% involved people first stopped at the border, and 20% involved someone convicted of a crime. DHS says more than 3 million people have left in total. MPI calls that “highly unlikely” and estimates 1.3 million to 2.4 million total departures over that period, counting both deportations and people who left on their own.
The immigrant population has stopped growing
✅ Confirmed Factual Lean note: Census survey data reported alike by Pew (center) and CIS (right). Lower survey response may exaggerate the drop.
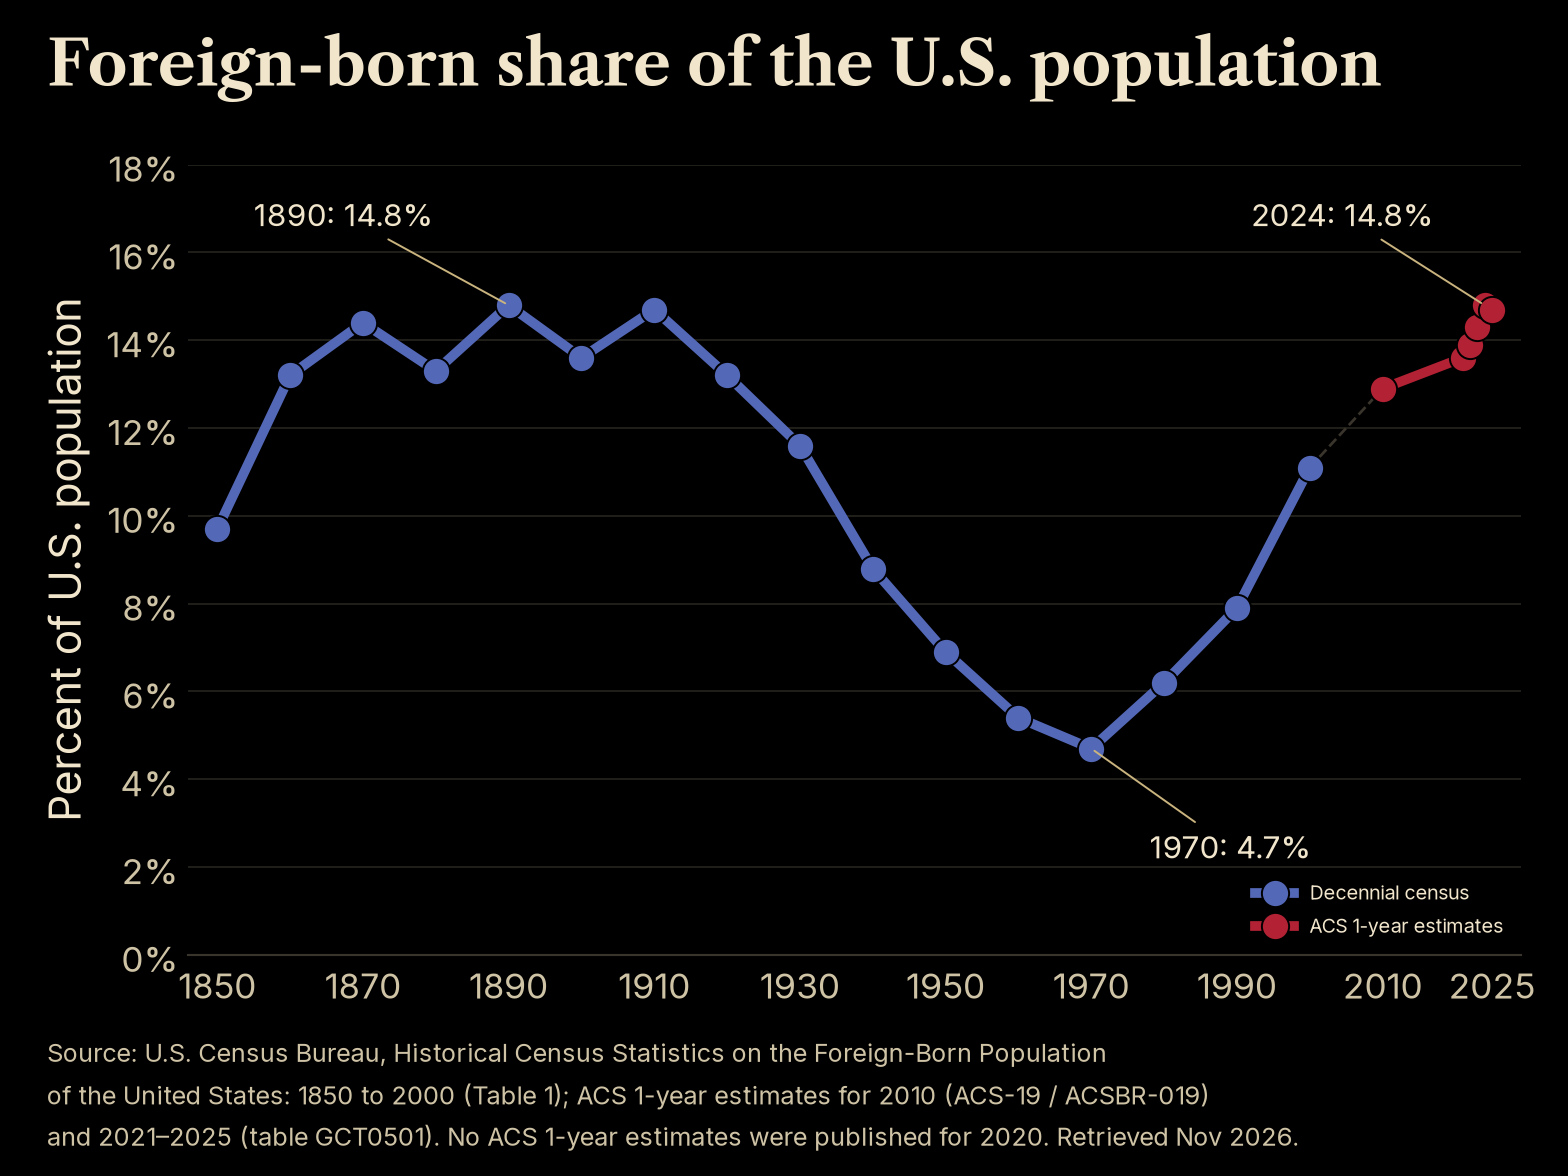
The foreign-born population peaked at 53.3 million in January 2025, a record 15.8% of the country, according to Pew’s reading of the Census Bureau’s Current Population Survey. It fell by about 1.5 million by June 2025. The 2025 American Community Survey shows growth of just 174,000 from mid-2024 to mid-2025. For perspective, the Census Bureau’s historical figures show the foreign-born share was 14.7% in 1910 and fell to a low of 4.7% in 1970.
Claims you will hear
Both sides repeat claims that don’t hold up. Here are some of the most common ones, held to the same standard.
- “There are 30 million, or even 100 million, illegal immigrants here.”
⚠️ Disputed Leans Right Lean note: Even the Center for Immigration Studies, which favors lower immigration, calls 20 to 30 million too high and 100 million “unserious.”
- “3 million illegal immigrants have left since January 2025.”
⚠️ Disputed Leans Right Lean note: This is a DHS claim. MPI estimates 1.3 million to 2.4 million total departures and says the DHS count likely includes legal residents and U.S. citizens. - “Illegal immigrants commit more crime than citizens.” Every crime by someone who should not have been here is a real harm to a real victim. The question is rates.
⚠️ Disputed Leans Right Lean note: Texas arrest data (PNAS, 2020) found lower felony arrest rates among undocumented immigrants than among U.S.-born citizens. Sweden’s crime research council notes that U.S. findings differ from Europe’s, where some migrant groups are overrepresented. - “Migrants crossing the border are the main source of fentanyl.”
⚠️ Disputed Leans Right Lean note: More than 85% of hard drugs caught at the southern border are seized at official ports of entry, and 83.5% of people federally sentenced for fentanyl trafficking in fiscal 2024 were U.S. citizens. - “Immigration has no downside for American workers or renters.”
⚠️ Disputed Leans Left Lean note: The National Academies found small overall wage effects but losses for earlier immigrants and workers without a high school diploma. A peer-reviewed study links immigrant inflows to higher local rents.
- “Immigrants are a drain on the budget.”
⚠️ Disputed Leans Right Lean note: It depends on the level of government and the time frame. The National Academies found costs fall mainly on state and local budgets, while immigrants’ adult children are strong net contributors. CBO projected the 2021–2026 surge would cut federal deficits by $0.9 trillion.
What compassion done right looks like
Compassion is more than a feeling. It is a set of choices that actually help people without breaking faith with the citizens who pay for them. Here is what that looks like when it is done properly.
Legal pathways that work, and work fast
✅ Confirmed Factual Lean note: TRAC, a nonpartisan data center at Syracuse University, built these figures from immigration court records. The court system’s own count differs slightly by date and method.
A system that takes years to say yes or no is not kind to anyone. At the end of September 2026, the immigration courts had 3,037,800 pending cases, and 2,259,317 of them involved asylum claims, according to TRAC. A strong claim deserves a fast hearing. A weak claim deserves a fast, respectful no. Employers who need workers should find legal channels, like seasonal farm visas, easier to use than hiring off the books.
A real refugee program
✅ Confirmed Factual Lean note: Figures from the State Department and the Federal Register. Reuters reported the same ceilings.
The U.S. admitted 100,034 refugees in fiscal 2024, the most since 1994, according to the State Department. The ceiling was cut to 7,500 for fiscal 2026, the lowest on record, and set at 17,500 for fiscal 2027, mostly for Afrikaners from South Africa. Refugees are vetted overseas before they travel, which is the orderly way to offer protection. Reasonable people can argue about the right number. Either way, a steady, well-vetted program beats a door that swings from wide open to nearly shut.
Help people where they live
✅ Confirmed Factual Lean note: Banxico (Mexico’s central bank) and peer-reviewed migration research. The research cuts against easy answers on both sides.
Far more people need help than could ever move here, which is the core point of the gumballs video discussed below. Migrants already do a lot of this themselves. Mexico received $61.8 billion in remittances in 2025, Banxico reports, down 4.6% from 2024. But aid is not a quick fix for border pressure. Research by economist Michael Clemens finds that emigration tends to rise, not fall, as very poor countries begin to develop, peaking when average incomes reach roughly $7,000 to $10,000 per person (adjusted for purchasing power). Aid is worth doing for its own sake. It will not empty a border line on its own.
Integration, not isolation
✅ Confirmed Factual Lean note: Germany’s federal labor research institute (IAB) and Sweden’s official crime research council (Brå).
Newcomers who learn the language and go to work become neighbors, not strangers. Germany’s experience shows integration takes years but does happen: 64% of refugees who arrived in 2015 were employed by 2022, according to the IAB. Sweden’s crime research council finds that access to the labor market plays an important role in whether migrants become involved in crime.
End the cartels’ business model
✅ Confirmed Factual Lean note: UN migration agency (IOM) and Justice Department records. The CBP figure on falling deaths is the agency’s own preliminary number.
A chaotic border is not a kind border. It hands the journey to smugglers. The International Organization for Migration counted at least 686 deaths and disappearances at the U.S.-Mexico border in 2022 and called it the world’s deadliest land migration route. In June 2022, 53 people died in a sweltering tractor-trailer in San Antonio. The smuggling ring’s leader was sentenced to life in prison in 2025. CBP says border-related deaths fell nearly 80% as crossings dropped, a preliminary figure we have not seen independently confirmed.
Why borders and sovereignty matter
A country that cannot decide who comes in is not fully self-governing. That is not hostility toward anyone. It is the basic job of a government that answers to its citizens.
Security and the rule of law
Screening who enters is the most basic job of a border. When arrivals outrun the system’s ability to vet people and decide cases, the rules stop meaning much, and the public loses trust in the whole system, legal immigration included. The steep drop in crossings since early 2025 shows that policy and enforcement choices change behavior. The 1986 amnesty, covered in the history section below, shows what happens when a promise of enforcement is not kept.
Fentanyl and trafficking: what the data say
✅ Confirmed Factual Lean note: CDC, CBP and U.S. Sentencing Commission data. WOLA, a left-leaning group, compiled the CBP seizure totals, which come from CBP’s own dataset.
Overdose deaths reached 107,941 in 2022 (CDC final data), fell to 79,384 in 2024, and dropped to nearly 68,000 in the 12 months ending March 2026, based on CDC provisional data analyzed by Axios. The poison is real, and so are the cartels behind it. But the data point to ports of entry and U.S. distribution networks more than to migrants on foot. More than 85% of hard drugs seized at the southern border are caught at official crossings. CBP’s fentanyl seizures there fell to 11,486 pounds in fiscal 2025. And 83.5% of people federally sentenced for fentanyl trafficking in fiscal 2024 were U.S. citizens. A secure border means inspection capacity at the ports as much as barriers between them.
Fiscal, housing and wage strain: the honest ledger
✅ Confirmed Factual Lean note: The National Academies (nonpartisan), CBO and BLS, plus a peer-reviewed housing study. Each side tends to quote only half of this ledger.
The costs. The National Academies of Sciences found that first-generation immigrants cost state and local governments more than they pay in, mainly for educating their children. It also found that wage losses, where they show up, fall on earlier immigrants and native-born workers without a high school diploma. Economist Albert Saiz found that an immigrant inflow equal to 1% of a city’s population was associated with roughly a 1% rise in rents and home values.
The benefits. The same National Academies report found that immigrants’ adult children are among the strongest fiscal contributors in the country. CBO estimated that the 2021–2026 immigration surge would raise GDP by $8.9 trillion and cut federal deficits by $0.9 trillion over 2024–2034. Immigrants made up 19.1% of the U.S. labor force in 2025, according to the Bureau of Labor Statistics. CBO projects that births will outnumber deaths only through 2029, after which population growth depends on immigration.
Our read. Immigration’s benefits are real and spread widely. Its costs are real and land locally. Both depend on how many people come, how fast and with what skills. That argues for a number set on purpose: not zero, and not whoever shows up.
The gumballs video
In 2010, Roy Beck, founder of the group NumbersUSA, posted an updated version of a talk he first recorded in 1996, Immigration, World Poverty and Gumballs. In about six minutes he stacks gumballs. One gumball stands for the roughly 1 million legal immigrants the U.S. had taken each year since 1990. Jars then fill up for the 3 billion people who, citing the World Bank, he says lived on less than $2 a day, and the 5.6 billion who lived in countries poorer than Mexico. Poor countries, he adds, were growing by about 80 million people a year. His conclusion is that immigration “can never be an effective or significant way” to relieve world poverty, and that helping people where they live matters more. He also argues that emigration drains poor countries of the energetic, educated people who could improve them.
The video has about 6.8 million views on NumbersUSA’s YouTube channel. Watch it on YouTube (6 minutes, NumbersUSA channel).
What the video gets right, and what critics say
✅ Confirmed Leans Right Lean note: Produced by NumbersUSA, an advocacy group for lower immigration. Its figures came from the World Bank and Census Bureau, but the framing argues one side.
What holds up. The arithmetic does. Even on today’s measures, the World Bank estimates about 838 million people lived in extreme poverty, under $3 a day, in 2022. No country could resettle a meaningful share of them. Moving people one at a time cannot replace helping poor countries grow.
What critics say. The figures are dated, since the World Bank has revised its poverty measures several times since 2010. Few people argue that immigration should be the main tool against world poverty, so critics call the premise a straw man. Each immigrant’s own life still changes, and the money they send home helps families there. The “brain drain” argument is also contested: research such as Clemens’s finds emigration rises as countries begin to develop, and remittances flow back.
What history shows: strain at home and abroad
Europe, 2015: a sudden wave
✅ Confirmed Factual Lean note: Pew, German government figures reported by DW, and Sweden’s official crime research council. The findings cut both ways, and we report both.
A record 1.3 million people applied for asylum in the European Union, Norway and Switzerland in 2015, according to Pew. Germany later put its own 2015 arrivals at 890,000. Sweden’s crime research council (Brå) reviewed the research in 2025 and concluded that the mid-2010s wave likely raised crime in countries that took in many asylum seekers relative to their population, at least in the short term, though the size of the effect is uncertain. The German studies found the increase in violent crime was in crimes against foreign nationals, while the number of victims with German citizenship went down. Integration did come, slowly: 64% of Germany’s 2015 refugees were employed by 2022.
Sweden: generous intake, hard lessons
✅ Confirmed Factual Lean note: Brå is Sweden’s government crime research agency. The BBC reported the asylum and unemployment figures.
Sweden took in about 163,000 asylum seekers in 2015, the BBC reported, and reintroduced border checks that November. Foreign-born unemployment stood at 16.2% in 2018, against 6.8% overall. Brå found in 2021 that Sweden’s gun-homicide rate was about 4 per million people a year, against a European average of about 1.6, driven mainly by conflicts between criminal gangs. Its 2025 review found that migrants in the Nordic countries are, on average, more involved in crime than native-born residents, more so for those who fled war and less so for those who came for work or study. The same review found that national crime trends are not driven by migration.
United Kingdom: a boom, then a bust
✅ Confirmed Factual Lean note: The Office for National Statistics and Oxford’s Migration Observatory (nonpartisan).
Net migration to the UK peaked at about 944,000 in the year ending March 2023, according to revised ONS figures, then fell to a provisional 171,000 in 2025. Most of the surge came through legal work and study visas, which shows that strain can come from legal numbers set too high, not only from illegal crossings. Asylum stayed high: 110,000 claims in the year to September 2025, the most since records began in 1979, with 36,000 asylum seekers housed in hotels.

United States, 1920s: quotas
✅ Confirmed Factual Lean note: The State Department’s Office of the Historian and Census Bureau historical statistics.
After decades of heavy immigration, Congress passed quotas in 1921 and tightened them in the Immigration Act of 1924, which limited each nationality to 2% of its population in the 1890 census and barred immigrants from Asia entirely. The State Department’s historians say the law’s basic purpose was “to preserve the ideal of U.S. homogeneity.” Along with the Depression and World War II, the quotas helped bring the foreign-born share down from 14.7% in 1910 to 4.7% in 1970. The lesson cuts two ways. A nation can set limits and has done so. But quotas built on ethnic preference were wrong, and the Immigration and Nationality Act of 1965 replaced them.
1986: amnesty without enforcement
✅ Confirmed Factual Lean note: MPI, which generally favors broader legal pathways, and Pew estimates as cited by CIS. Both sides agree the enforcement half failed, though they draw different lessons.
The Immigration Reform and Control Act legalized nearly 2.7 million people and promised to stop future illegal hiring with employer penalties. The penalties were undermined by fake documents and subcontracting, MPI concludes, and the unauthorized population roughly tripled after the law passed. Pew’s estimates rose from 3.5 million in 1990 to 12.2 million in 2007. One side’s lesson: never trade legalization for enforcement promises again. MPI’s lesson: the law also failed because it gave employers no legal way to hire the workers they kept needing.
Mariel boatlift, 1980: the wage debate
⚠️ Disputed Factual Lean note: Peer-reviewed economists disagree, and we present both sides.
About 125,000 Cubans reached Miami in a few months in 1980, adding about 7% to the city’s labor force. Economist David Card (1990) found no measurable harm to wages or jobs for less-skilled workers. George Borjas (2017) reanalyzed the data and found wages of low-skilled men fell 10% to 30%. Giovanni Peri and Vasil Yasenov found no significant effect and argued Borjas’s result rests on small samples. The debate is still open, which is itself a lesson: even a sudden inflow doesn’t settle the question.
Our view: We the people can be generous and still be a nation. We would love to help everybody, and the United States is home to more immigrants than any other country on earth. But generosity without limits stops being generosity. It becomes a promise no one can keep: to newcomers stuck in a years-long line, to workers at the bottom of the wage ladder, and to towns asked to absorb more than their schools and housing can handle. A sovereign country sets a number on purpose, enforces it fairly, knows who is coming, and keeps the door open through legal channels it can actually sustain. Secure borders are not the opposite of compassion. They are what make lasting compassion possible.
Common ground
Americans agree on more than the shouting suggests. In Gallup’s June 2026 polling, 73% said immigration is a good thing for the country. On the level of immigration, 35% wanted it kept where it is, 31% wanted it increased and 29% wanted it decreased. Large majorities, 81%, favored a path to citizenship for people brought here illegally as children if they meet certain requirements, while 58% opposed deporting everyone here illegally. Respondents were evenly split, 49% to 48%, on hiring many more Border Patrol agents.
Where we think people on both sides could meet:
- A secure, orderly border, with asylum decisions that are fast and fair.
- Going after smugglers and cartels, not the people they exploit.
- Legal work channels that employers will actually use, so jobs don’t pull people across illegally.
- A yearly number set openly by Congress, then actually enforced.
- Help for newcomers to learn English and go to work, which serves them and their neighbors.
Talk it over
Questions worth discussing at the kitchen table:
- How many newcomers a year can your town absorb well, in schools, housing and jobs?
- What should happen to people who have lived here illegally for many years and have U.S.-citizen children?
- Is helping people in their home countries a better use of compassion than resettling some of them here?
- What would make you trust that a future deal would actually be enforced?
Ground rules: Argue the idea, not the person. Name your source. Assume good faith. No slurs or dehumanizing labels for anyone, whether immigrants, officers or each other. Reader comments are not open on Candid Dragon yet, so share this piece and talk it over with people you trust, including someone who sees it differently.
Who is behind the numbers
- Factual CBP, DHS (OHSS), CBO, Census Bureau, BLS, CDC, U.S. Sentencing Commission, State Department: official federal data. Press releases from any administration add political framing; we use the figures, not the adjectives.
- Factual Pew Research Center, Gallup, the National Academies, TRAC: nonpartisan research and polling.
- Factual Migration Policy Institute: a nonpartisan think tank (AllSides rates it Center) whose policy work generally favors broader legal pathways.
- Leans Right Center for Immigration Studies: favors lower immigration; AllSides rates it Right. Its population estimates track others closely.
- Leans Right NumbersUSA: advocacy group for lower immigration, producer of the gumballs video.
- Leans Left WOLA and the Center for Migration Studies of New York: human-rights and migrant-advocacy groups. We used WOLA’s compilation of CBP’s own seizure data.
- Factual Brå (Sweden), IAB (Germany), ONS and Oxford’s Migration Observatory (UK), IOM (UN): government agencies and academic or international bodies.
Label key
- ✅ Confirmed An official record, or two or more independent outlets, agree.
- ❓ Unconfirmed Reported or claimed, but not yet independently verified.
- ⚠️ Disputed Contradicted by the evidence or by credible sources, or actively contested.
- Factual Straight reporting that holds up across outlets on different sides.
- Leans Left The facts hold, but the coverage tilts left: one-sided, loaded language, missing context or a single anonymous source.
- Leans Right The facts hold, but the coverage tilts right: one-sided, loaded language, missing context or a single anonymous source.
 Likely Propaganda State-run or state-aligned media, a militant press office, a partisan campaign or group, or unverifiable spin.
Each story gets one confidence tag and one source-lean label, plus a one-line Lean note explaining the call. Every side is held to the same standard. More on how we cover the news.
Sources
- DHS Office of Homeland Security Statistics, Yearbook 2024, Table 1: Persons Obtaining Lawful Permanent Resident Status
- DHS OHSS, Estimates of the Unauthorized Immigrant Population: January 2018–January 2022
- CBP, “DHS announces lowest fiscal year border crossings in American history” (Oct. 16, 2026)
- CBP, “Lowest fiscal year for Border Patrol apprehensions since 1970” (Oct. 7, 2025)
- CBP, Nationwide Encounters, Fiscal Year 2026
- Pew Research Center, “Migrant encounters at the U.S.-Mexico border are at their lowest level in more than 50 years” (Feb. 2, 2026)
- Pew Research Center, “U.S. unauthorized immigrant population reached a record 14 million in 2023” (Aug. 21, 2025)
- Stateline, “Undocumented immigration population reached as high as 15.8M, report finds” (July 29, 2026)
- Center for Immigration Studies, “Illegal Immigrant Population Was About 13.5 Million in July 2026” (Sept. 14, 2026)
- Center for Immigration Studies, “New American Community Survey Shows Slowdown in Foreign-Born Growth through Mid-2025” (Oct. 30, 2026)
- DHS, “ICE Breaks Records in Fiscal Year 2026” (Nov. 12, 2026)
- Migration Policy Institute, “Deportations During First 18 Months of Trump Administration Reach Highest Level in Years” (Oct. 21, 2026)
- Census Bureau, Historical Census Statistics on the Foreign-born Population of the United States: 1850–1990
- Light, He and Robey, “Comparing crime rates between undocumented immigrants, legal immigrants, and native-born US citizens in Texas,” PNAS (2020)
- Brå (Swedish National Council for Crime Prevention), Migration and crime, report 2025:7
- Brå, Gun homicide in Sweden and other European countries (2021)
- U.S. Sentencing Commission, FY2024 Quick Facts: Fentanyl Trafficking
- WOLA, Weekly U.S.-Mexico Border Update: fiscal 2025 drug seizure data (Nov. 7, 2025)
- CDC NCHS, Drug Overdose Deaths in the United States, 2004–2024 (Data Brief 549)
- Axios, “U.S. overdose deaths drop 12%, per CDC estimates” (Nov. 3, 2026)
- TRAC Immigration, Immigration Court quick facts (through September 2026)
- State Department Refugee Processing Center, FY2024 refugee arrivals
- Federal Register, Presidential Determination on Refugee Admissions for Fiscal Year 2026
- Federal Register, Presidential Determination on Refugee Admissions for Fiscal Year 2027
- Banco de México, Ingresos y Egresos por Remesas, diciembre de 2025
- Clemens, “Does Development Reduce Migration?” IZA Discussion Paper 8592
- IAB press release on refugee employment eight years after arrival (in German)
- IOM, “US-Mexico Border World’s Deadliest Migration Land Route”
- U.S. Justice Department, sentencing in the San Antonio tractor-trailer smuggling deaths (June 27, 2025)
- National Academies, The Economic and Fiscal Consequences of Immigration, report brief (2016)
- Congressional Budget Office, Effects of the Immigration Surge on the Federal Budget and the Economy (July 2024)
- Congressional Budget Office, The Demographic Outlook: 2026 to 2056
- Bureau of Labor Statistics, Foreign-Born Workers: Labor Force Characteristics, 2025
- Saiz, “Immigration and Housing Rents in American Cities,” IZA Discussion Paper 2189
- NumbersUSA, Immigration, World Poverty and Gumballs (YouTube, 2010)
- World Bank, June 2025 Update to Global Poverty Lines
- Pew Research Center, “Record 1.3 Million Sought Asylum in Europe in 2015” (2016)
- DW, “Germany revises refugee influx to 890,000” (2016)
- BBC, “Nationalist vote set to shatter Swedish calm” (2018)
- ONS, Long-term international migration, provisional: year ending December 2025
- ONS, Improving long-term international migration statistics (November 2025)
- Migration Observatory, University of Oxford, “Net migration falls 78% in two years” (Nov. 27, 2025)
- State Department Office of the Historian, The Immigration Act of 1924
- Migration Policy Institute, IRCA in Retrospect: Guideposts for Today’s Immigration Reform
- Card, “The Impact of the Mariel Boatlift on the Miami Labor Market” (NBER, 1989)
- Borjas, “The Wage Impact of the Marielitos: A Reappraisal,” ILR Review (2017)
- Peri and Yasenov, “The Labor Market Effects of a Refugee Wave” (NBER)
- Gallup, “Americans’ Support for Immigration Down, Still Strong” (July 9, 2026)
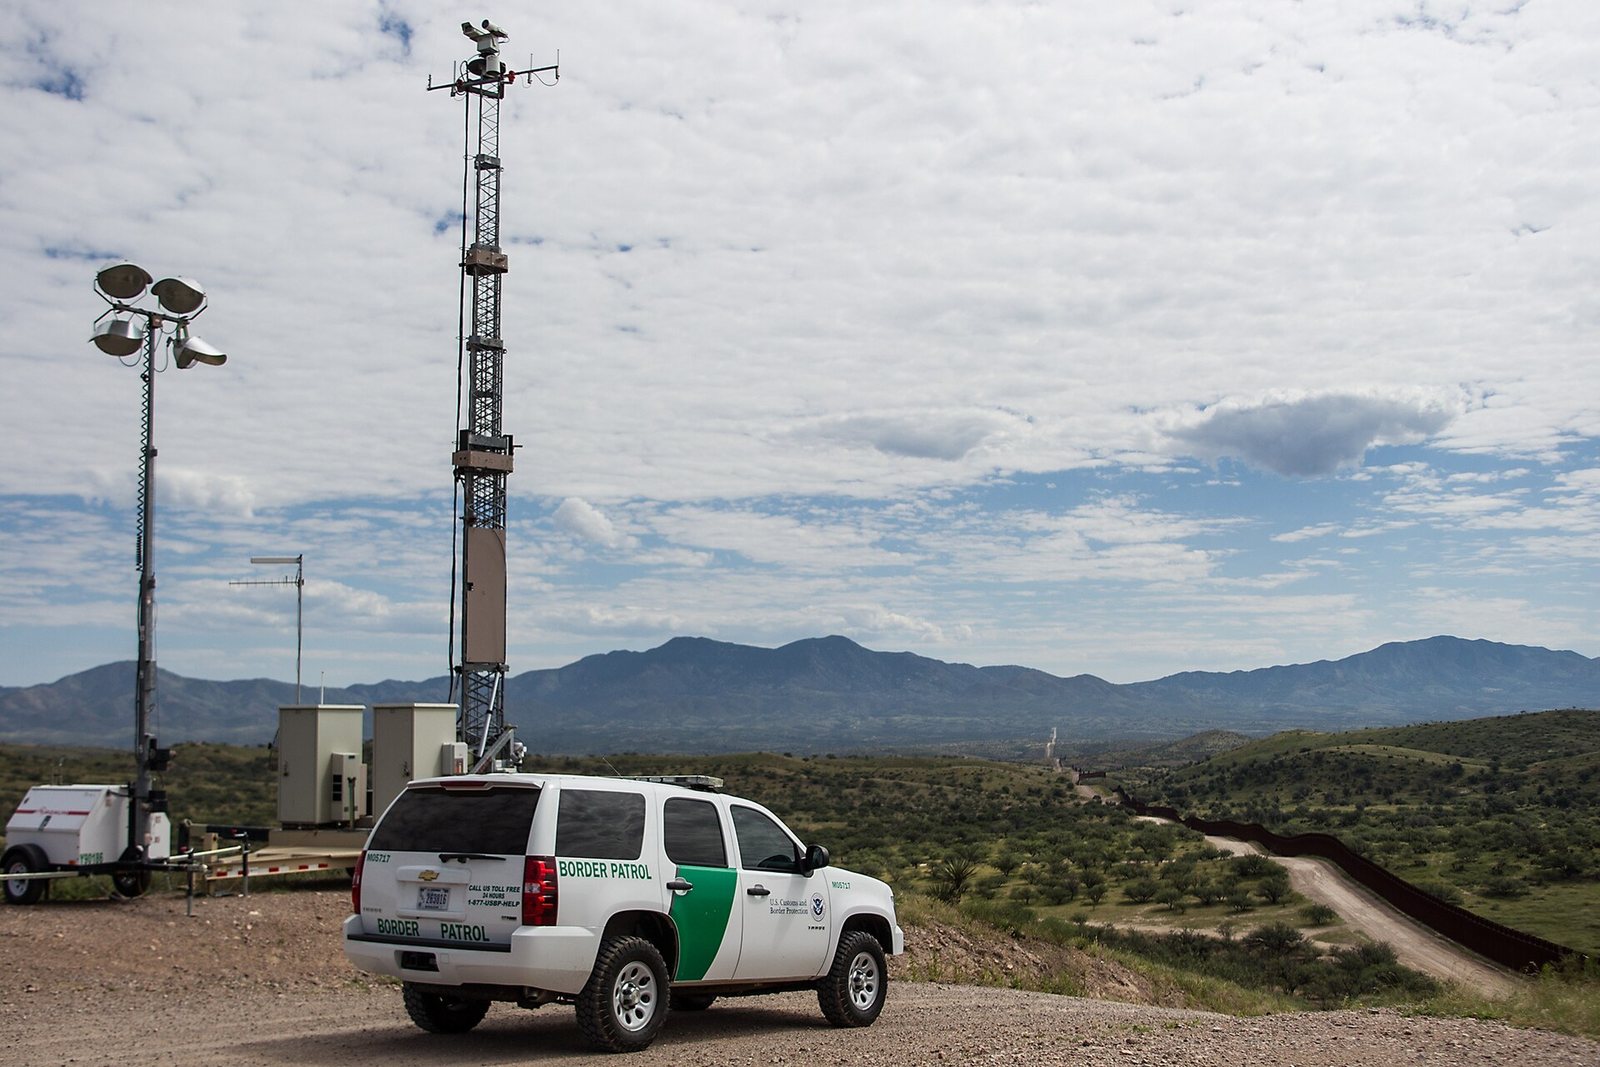
Featured image: Mobile Tower 4 (border fence & BP SUV) (Nogales), by CBP Photography. Public domain, via Wikimedia Commons. See all image credits.