

A single poll is a snapshot with a blur around it. A statistic without context can mean almost anything. Here is what to check.
Polls: five questions
- Who was asked? Adults, registered voters or likely voters can give different answers.
- How many, and how? A random sample of about 1,000 people has a margin of error of roughly plus or minus 3 points. That applies to each candidate’s number, so a 2-point lead is within the noise.
- Who paid for it? Campaign polls released to the press are chosen to help the campaign.
- How was it weighted? Good pollsters publish how they adjusted for age, education and past vote.
- What do the averages say? One outlier poll is news; the average is the story.
How accurate have the polls been?
Using FiveThirtyEight’s published database of polls taken in the final three weeks, we averaged how far national presidential polls missed the final margin each cycle, and which way they tilted.
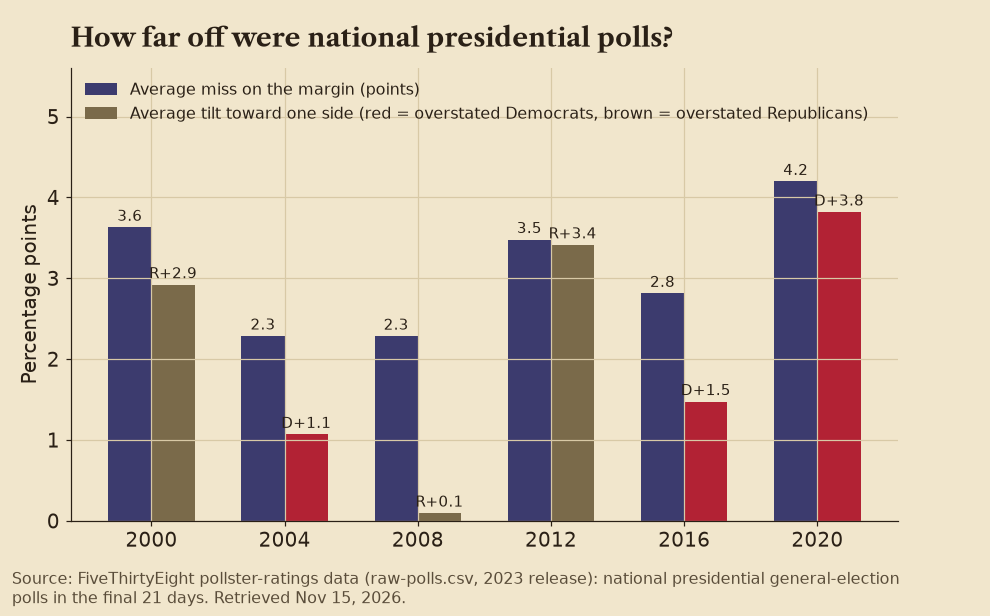
The misses ranged from about 2.3 points (2004 and 2008) to 4.2 points (2020). The tilt changes direction: polls overstated Republicans in 2000 and 2012 and Democrats in 2016 and 2020. The industry’s own review of 2020, by the American Association for Public Opinion Research, called it the largest national polling error in 40 years.
✅ Confirmed  Factual Lean note: Computed by us from FiveThirtyEight’s raw polling data; AAPOR’s task-force report reaches the same conclusion about 2020.
Statistics: four traps
- Relative vs. absolute risk: “Doubles your risk” can mean going from 1 in a million to 2 in a million.
- Correlation vs. causation: Two things rising together does not mean one causes the other.
- Cherry-picked start dates: Move the starting year and a trend can vanish or reverse.
- Truncated axes: A chart whose vertical axis starts at 95 instead of 0 makes a small change look huge.
Label key
- ✅ Confirmed An official record, or two or more independent outlets, agree.
- ❓ Unconfirmed Reported or claimed, but not yet independently verified.
- ⚠️ Disputed Contradicted by the evidence or by credible sources, or actively contested.
- Factual Straight reporting that holds up across outlets on different sides.
 Leans Left The facts hold, but the coverage tilts left: one-sided, loaded language, missing context or a single anonymous source.
 Leans Right The facts hold, but the coverage tilts right: one-sided, loaded language, missing context or a single anonymous source.
 Likely Propaganda State-run or state-aligned media, a militant press office, a partisan campaign or group, or unverifiable spin.
Each story gets one confidence tag and one source-lean label, plus a one-line Lean note explaining the call. Every side is held to the same standard. More on how we cover the news.
Sources
- FiveThirtyEight, pollster ratings data (GitHub)
- AAPOR, Task Force on 2020 Pre-Election Polling
- Pew Research Center, 5 key things to know about the margin of error