

Inflation is a general rise in prices, which means each dollar buys less. The most-watched measure is the Consumer Price Index (CPI-U), which the Bureau of Labor Statistics builds every month by pricing a basket of goods and services that urban households buy, from rent and gasoline to eggs and car insurance.
What the numbers show
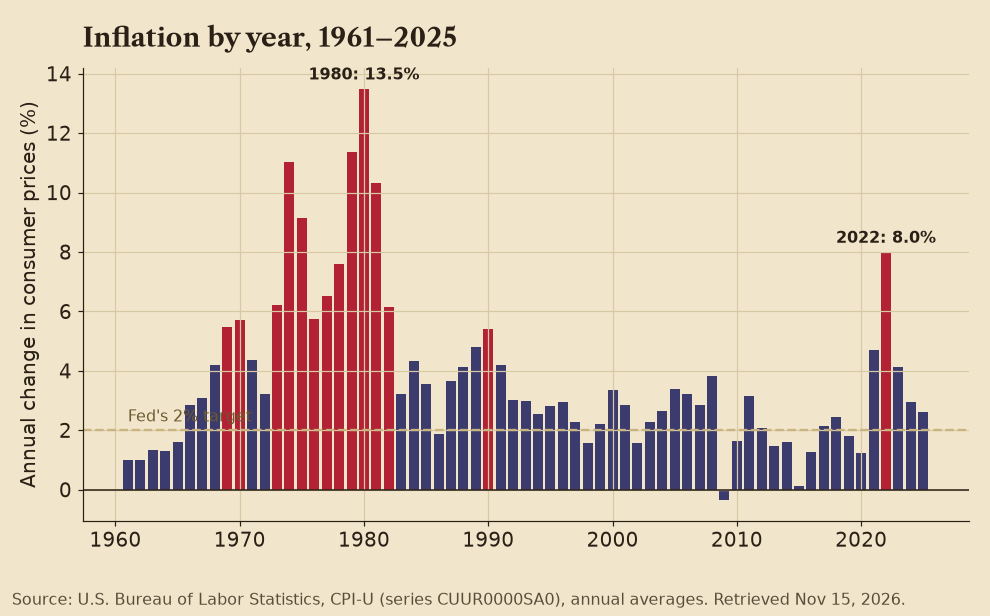
- Inflation peaked at 13.5% in 1980 and hit 8.0% in 2022, the highest annual rate in four decades.
- It was 4.1% in 2023, 2.9% in 2024 and 2.6% in 2025 (annual averages).
- In the most recent 12 months BLS can measure, September 2025 to September 2026, prices rose 3.7%. BLS did not publish an October 2025 index because of the federal government shutdown, so the October 2026 year-over-year rate cannot be calculated the usual way.
- Put simply: something that cost $100 on average in 2020 cost about $130 in October 2026.
✅ Confirmed  Factual Lean note: Every figure is calculated from BLS CPI-U index values (series CUUR0000SA0).
Why it happens
- Too much money chasing too few goods: Big jumps in spending or money supply, without matching growth in what is produced.
- Supply shocks: Oil embargoes in the 1970s, or pandemic shutdowns and shipping snarls in 2021 and 2022.
- Expectations: When people expect prices to rise, they ask for raises and pay more now, which can keep it going.
- Policy: Economists across the spectrum debated how much 2021–2022 inflation came from pandemic stimulus spending versus supply problems. Most research credits both.
❓ Unconfirmed Factual Lean note: The split between causes is still debated in the economic literature.
What it means for your wallet
- Cash in a checking account loses buying power. Compare your savings rate with the inflation rate.
- Fixed-rate debt gets easier to repay in real terms; variable-rate debt usually gets more expensive as rates rise.
- Social Security gets a yearly cost-of-living adjustment tied to a CPI measure; many paychecks do not.
- Series I Savings Bonds from TreasuryDirect pay a rate tied to inflation.
Not financial advice. This is general education from public sources, not financial advice for your situation. Talk to a qualified professional before you act.
Label key
- ✅ Confirmed An official record, or two or more independent outlets, agree.
- ❓ Unconfirmed Reported or claimed, but not yet independently verified.
- ⚠️ Disputed Contradicted by the evidence or by credible sources, or actively contested.
- Factual Straight reporting that holds up across outlets on different sides.
 Leans Left The facts hold, but the coverage tilts left: one-sided, loaded language, missing context or a single anonymous source.
 Leans Right The facts hold, but the coverage tilts right: one-sided, loaded language, missing context or a single anonymous source.
 Likely Propaganda State-run or state-aligned media, a militant press office, a partisan campaign or group, or unverifiable spin.
Each story gets one confidence tag and one source-lean label, plus a one-line Lean note explaining the call. Every side is held to the same standard. More on how we cover the news.
Sources
- U.S. Bureau of Labor Statistics, Consumer Price Index
- BLS Data Viewer, CPI-U all items (CUUR0000SA0)
- TreasuryDirect, I Bonds
- Social Security Administration, Cost-of-Living Adjustment