

Chatter watch identified a viral meme claiming the stock market has wiped out about $5 trillion since Democrats won the midterms. The same wording was posted on X on Thursday afternoon, November 19, then spread widely during Friday’s sell-off (about 3,800 posts on Friday, UTC, including reposts).
Quick take
- A viral meme says the stock market has wiped out about $5 trillion since Democrats’ midterm win, and tells readers to thank a Democrat.
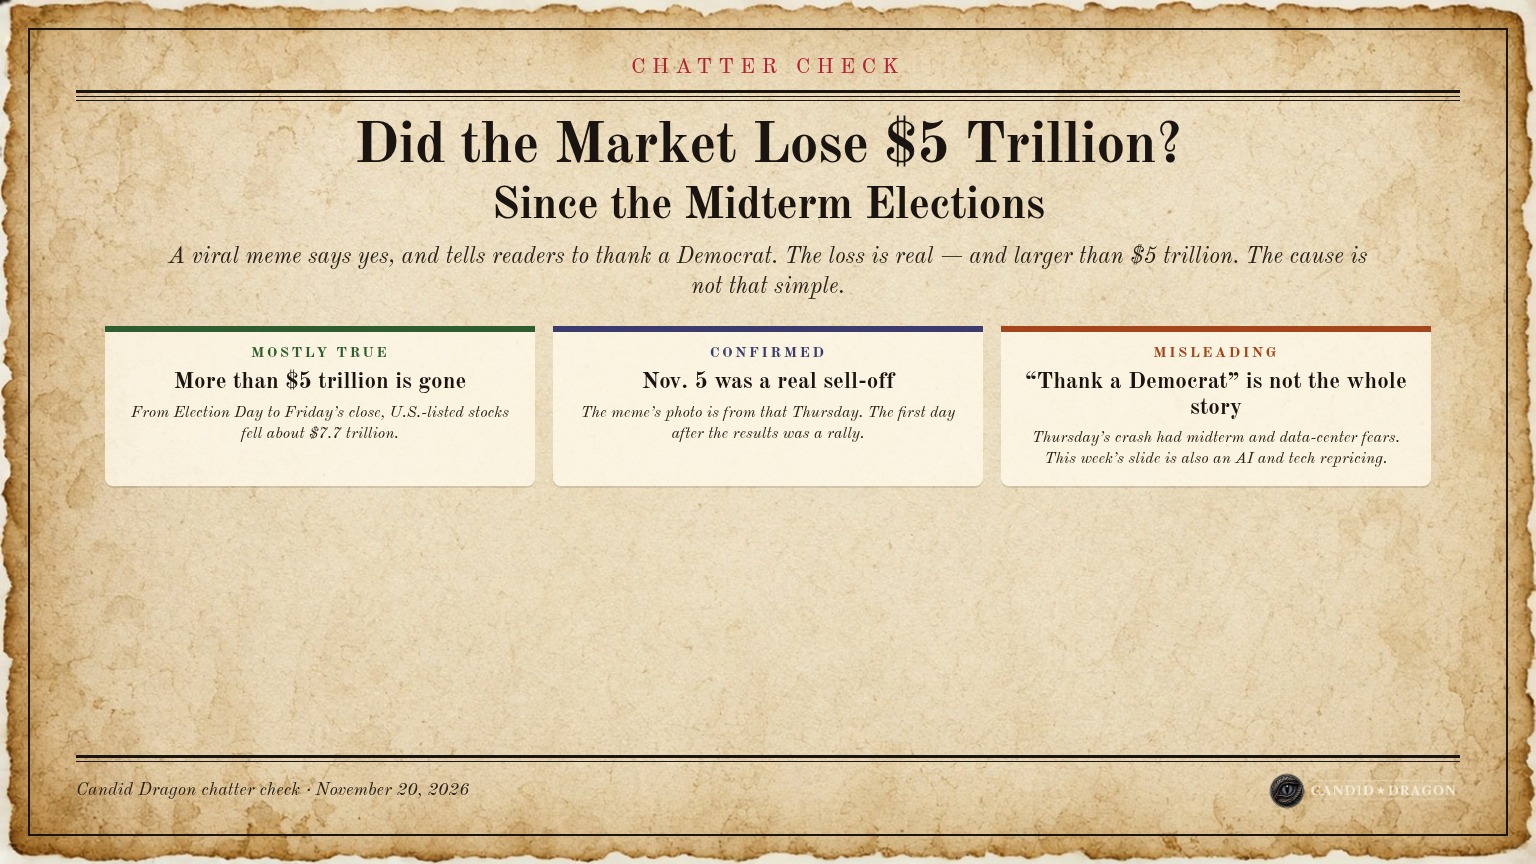
- The market has lost more than $5 trillion since Election Day. About $5 trillion is low, not high, for that window.
- From the November 3 close to the November 20 close, the S&P 500 fell 8.7%, the Nasdaq Composite 10.9%, the Dow 7.0%, and the FT Wilshire 5000 8.6%.
- All stocks listed on U.S. exchanges fell about $7.7 trillion over that span, from $96.96 trillion to $89.29 trillion.
- The meme’s photo is from Thursday, November 5, a real sell-off day. The first full session after the results, Wednesday, November 4, was a rally: the Dow jumped 1,569 points.
- Thursday’s crash was widely tied to the scale of the Democratic wins and data-center fears, and also to weak chip earnings and earlier AI-valuation worries.
- Friday’s close is being blamed mainly on an AI and tech repricing. The midterms are one headwind among several, not the only cause.
Our rating: ✅ Confirmed on the market loss, which is Mostly True (and understated). The “thank a Democrat” line is Misleading.  Factual
Last updated November 20, 2026, 10:44 p.m. CT.
✅ Confirmed Factual Lean note: The index levels and the direction of the loss are confirmed by official closes and a published total-market series. Keep the claims separate: the dollar loss since Election Day is real and larger than $5 trillion. Treating the midterm win as the only cause is misleading. Wednesday was a rally after the same results, and this week’s further slide is being tied mainly to an AI and tech repricing.
What the meme says
A meme circulating on Facebook and X this week says: “BREAKING: The stock market has WIPED OUT ~$5 trillion in value since the Democrats’ midterm ‘win’! Make sure to thank a Democrat.” The image is a photograph of the New York Stock Exchange floor, with a board dated Thursday, November 5, 2026, and a CNBC “Market Sell-off” screen. The same wording was posted on X at 4:31 p.m. CT on Thursday, November 19, by the account @MAGAVoice, and then widely copied.
The numbers, so you can check the math
The meme says “since the Democrats’ midterm win.” Markets were open on Election Day, Tuesday, November 3. Results came in that night. The clean window is the November 3 close through the latest close, Friday, November 20.
Index closes, from CNBC (Factual) for November 3 and from CNBC (Factual) and UPI (Factual) for November 20, matching Yahoo Finance (Factual) historical data, including the FT Wilshire 5000 Total Market Index:
| Index | Nov. 3 close | Nov. 20 close | Change | Percent |
|---|---|---|---|---|
| S&P 500 | 7,568.92 | 6,910.39 | −658.53 | −8.70% |
| Nasdaq Composite | 25,372.01 | 22,617.73 | −2,754.28 | −10.86% |
| Dow Jones Industrial Average | 51,786.72 | 48,147.33 | −3,639.39 | −7.03% |
| FT Wilshire 5000 | 75,459.08 | 68,957.11 | −6,501.97 | −8.62% |
For dollars, we use a published total-market series, not an estimate from index points. The Clay Total Market Index (Factual) sums company-level market caps for every stock listed on the NYSE, Nasdaq and NYSE American, including foreign companies listed in the United States. That universe is broader than the Wilshire 5000, which is built around U.S.-headquartered companies, so treat it as a wider-universe measure, not a Wilshire substitute.
- November 3 close: $96.96 trillion
- November 20 close: $89.29 trillion
- Change: $96.96 trillion − $89.29 trillion = −$7.67 trillion (−7.91%)
That is larger than $5 trillion. The Wilshire 5000’s 8.62% drop over the same window is in the same range — slightly steeper, as expected for a U.S.-company index that does not include all foreign listings. On November 20, Clay’s U.S. domestic-filer subset was $69.72 trillion, close to the Wilshire level of 68,957.11.
Verdict on the $5 trillion figure in this window: understated, not exaggerated.
Wednesday was a rally. Thursday was a crash.
The first full session after the results was not a sell-off. On Wednesday, November 4, CNBC (Factual) reported that the Dow soared 1,569.40 points, or 3.03%, to 53,356.12, its best day since April 2025, on a “clear-cut Democratic win” and falling oil, with President Trump accepting the results. The S&P 500 gained 1.58% to 7,688.62. The Nasdaq Composite jumped 1.44% to 25,736.51. The Wilshire 5000 closed at 76,621.02. Clay’s total rose to $98.18 trillion.
From that Wednesday high to Friday’s close, the same Clay series fell from $98.18 trillion to $89.29 trillion, or −$8.89 trillion (−9.05%). The S&P 500 was down 10.12%, the Nasdaq 12.12%, the Dow 9.76%, and the Wilshire 10.00%.
Thursday, November 5 — the day in the photograph — was a real, brutal session. CNBC (Factual) said the S&P 500 dropped 4.36% to 7,353.73, the Nasdaq Composite 5.52% to 24,315.00, and the Dow 1,833.06 points, or 3.44%, to 51,523.06. All three had their worst day since April 2025. The Wilshire 5000 fell 4.38% to 73,264.75. Clay’s total fell $4.29 trillion (−4.37%) that day, from $98.18 trillion to $93.89 trillion.
The board in the meme is dated Thursday, November 5, 2026. CNBC’s live coverage that day documented the plunge, and a “Market Sell-off” graphic fits the session. After Wednesday’s rally is counted, the net decline from Election Day through that Thursday close was much smaller than $5 trillion: the Wilshire 5000 was down 2.91%, and Clay’s total fell from $96.96 trillion to $93.89 trillion, or −$3.07 trillion.
Do not add the S&P 500 and the Nasdaq together
Named outlets published one-day dollar figures for November 5. They should be kept separate, because many companies sit in both indexes.
- MarketWatch (Factual) said the S&P 500 lost an estimated $2.9 trillion in market cap, “the largest one-day loss of market value on record.”
- NBC News (Factual) said the S&P 500 erased $2.8 trillion, and that the Nasdaq 100 dropped 6.3% and erased $2.3 trillion.
- The New York Post (Leans Right) reported that S&P 500 firms shed $2.9 trillion and Nasdaq companies lost $2.5 trillion, “both single-day records,” and that the Magnificent 7 alone lost $1.04 trillion.
A second New York Post article (Leans Right) then said “S&P 500 and Nasdaq companies shed a combined $5.4 trillion.” That sum double-counts companies in both indexes. It is not a clean measure of total market value lost that day, and we do not use it as a total. The non-overlapping Clay figure for November 5 is about $4.3 trillion, in line with the S&P-only $2.8–$2.9 trillion plus stocks outside the S&P 500.
What caused the drop
The midterm result was a real part of Thursday’s story, and mainstream coverage said so at the time. Credit that plainly.
Reuters (Factual), CNBC, and NBC News all described Thursday, November 5, as a tech-led rout after the scale of the Democratic sweep, especially wins in data-center states and new governors — including Gina Hinojosa in Texas — who had pledged to slow or halt data-center projects. CNBC noted that Sen. Bernie Sanders had called for a national moratorium. CNBC quoted Tim Holland of Orion saying investors were “stepping away until they get a better sense of the implications of the midterms around the AI capex cycle.” NBC quoted Ed Yardeni calling Thursday “the cold shower that I anticipated might occur after a blue-wave situation.” President Trump said on Truth Social that the market “suffered one of the Worst Days in History based on the results of the Election” and that “it wasn’t Republicans, it was Dumocrats.”
That is not the whole story, and “thank a Democrat” leaves the rest out.
- The first full session after the same results, Wednesday, November 4, was a sharp rally. CNBC’s headline tied the Dow’s 1,569-point jump to the Democratic win, falling oil, and Trump’s acceptance of the results, with some investors treating divided government as market-friendly. AI-related names were already under pressure that day, but the major averages rose.
- Thursday’s selling had more than one trigger. NBC said the sell-off was also “triggered by two lackluster earnings reports” from Qualcomm and Arm on Wednesday night. David Bahnsen, quoted in the New York Post, blamed valuations “completely disconnected from reality.” Yardeni, in the same NBC piece, described an “AI bubble losing some air,” a worry that predated Election Day. CNBC on November 3 was already writing about AI cost-of-capital concerns.
- The decline did not stop on November 5, and the drivers cited for this past week are broader. On Friday, November 20, the S&P 500 fell 3.7% to 6,910.39 and entered correction territory; the Nasdaq fell 5.3% to 22,617.73 and turned negative for 2026; the Dow fell 1.93% to 48,147.33, also in a correction, according to CNBC, UPI, Investing.com (Factual), and the Washington Post (Leans Left outlet; this item is market reporting). CNBC and UPI framed Friday as an AI and tech repricing after Anthropic’s IPO failed to revive the trade, with Nvidia down about 14%, plus worries about AI returns, slower data-center buildouts, and possible further Federal Reserve rate hikes. CNBC still listed Democratic midterm wins among the recent headwinds, alongside Nvidia headlines and capital-expenditure doubts — one factor, not the only one.
Hold both facts at once: U.S. stocks are down more than $5 trillion since Election Day, and mainstream outlets tied the November 5 crash in large part to the Democratic sweep and data-center politics. The midterm win is not the only cause, and the first market reaction to the results was a rally, not a crash.
What to watch
- Whether the major averages stabilize after Friday’s close, or the AI and tech slide continues.
- Any concrete data-center legislation, moratoriums, or permitting changes in Congress or in large data-center states, especially Texas.
- Updated total-market figures if Monday’s close moves the Election Day-to-now loss by a large amount.
Latest updates
🔄 November 20, 2026, 10:44 p.m. CT: First published, using Friday’s closing index levels and the Clay Total Market Index close of $89.29 trillion. We will update this page if Monday’s close changes the Election Day-to-now loss by a large amount, or if a primary total-market series from FT Wilshire or another major index provider publishes a directly comparable dollar figure for the same window.
Label key
- ✅ Confirmed An official record, or two or more independent outlets, agree.
- ❓ Unconfirmed Reported or claimed, but not yet independently verified.
- ⚠️ Disputed Contradicted by the evidence or by credible sources, or actively contested.
- Factual Straight reporting that holds up across outlets on different sides.
 Leans Left The facts hold, but the coverage tilts left: one-sided, loaded language, missing context or a single anonymous source.
 Leans Right The facts hold, but the coverage tilts right: one-sided, loaded language, missing context or a single anonymous source.
 Likely Propaganda State-run or state-aligned media, a militant press office, a partisan campaign or group, or unverifiable spin.
Each story gets one confidence tag and one source-lean label, plus a one-line Lean note explaining the call. Every side is held to the same standard. More on how we cover the news.
Sources
- CNBC, stock market news for November 3, 2026 (Factual)
- CNBC, “Dow soars 1,500 points for best day since April 2025 on clear-cut Democratic win, falling oil,” November 4, 2026 (Factual)
- CNBC, stock market news for November 5, 2026 (Factual)
- CNBC, “S&P 500 and Dow close in correction; Nasdaq erases 2026 gain as AI rout picks up steam,” November 20, 2026 (Factual)
- Yahoo Finance, Wilshire 5000 Total Market Index historical data (Factual)
- Pedro Oliveira Jr., UPI, “Dow, S&P 500 enter correction as Nasdaq plunges in AI stock sell-off,” November 20, 2026 (Factual)
- Investing.com, “U.S. stocks lower at close of trade; Dow Jones Industrial Average down 1.93%,” November 20, 2026 (Factual)
- Clay Total Market Index, total U.S. stock market capitalization, November 20, 2026 close (Factual)
- MarketWatch, “Tech stocks log worst day since 2020 as carnage comes to the AI trade,” November 5, 2026 (Factual)
- Steve Kopack and Allie Canal, NBC News, “Stocks plunge as election outcome and AI worries crush tech shares,” November 5, 2026 (Factual)
- David Lawder, Steve Holland and Noel Randewich, Reuters, “Democrats’ election win spooks AI investors, hammering stocks,” November 5, 2026 (Factual)
- Taylor Herzlich, New York Post, “Wall Street sees biggest market cap drops ever after midterm bloodbath for GOP,” November 5, 2026 (Leans Right)
- Victor Nava, New York Post, “Trump pins US stock market plunge on Democrats wiping out GOP in midterms,” November 5, 2026 (Leans Right)
- Todd C. Frankel and Shira Ovide, Washington Post, “U.S. stocks slump into correction territory amid tech and AI worries,” November 20, 2026 (Leans Left outlet; this item is market reporting)
- @MAGAVoice, X post, November 19, 2026, 4:31 p.m. CT
Featured image: Candid Dragon almanac graphic, November 20, 2026. See all image credits.